Introduction
Tympanoplasty (TP) is a technique that restores the functions of the middle ear (ME) after removing irreversible lesions from the cavity, and it broadly includes canaloplasty, myringoplasty, and ossiculoplasty. TP was first devised by Wullstein and Zollner in the 1950s.1,2) Following this, Wullstein classified TP into five main types. TP type I is a technique to regenerate the graft in the inner or outer side of the malleus handle by regenerating only the perforated tympanic membrane (TM) when all the ossicles are intact.1) The reported graft success rate of microscopic tympanoplasty (MT) ranges between 83% and 100%.3-5) Although the surgery has a high success rate, numerous types of techniques and graft materials have been developed owing to technological innovations.6,7) In this regard, the operation of the ME using an endoscope has also been developed and used, since it was first introduced by Mer in 1967.8) The field of view is difficult to secure using a conventional microscope, leading to poor visualization with additional incision.9) In contrast, compared to the use of microscope-assisted surgery, that of endoscopic surgery is increasing because of a wide field of view, high-definition video imaging, better quality of images, and in particular, because it is a minimally invasive surgery requiring no retro-auricular skin incision.10)
With the increased frequency of endoscopic surgery, several studies on its comparison with conventional microscopic surgery have been conducted.11-15) Hence, this study aimed to compare the graft success rate and hearing outcomes in endoscopic and microscopic retro-aural approaches.
Materials and Methods
We retrospectively reviewed the data of patients who underwent TP type I, performed by a single surgeon at the Pusan National University Hospital (PNUH) between April 2011 and June 2019. Patients who underwent TP type I with other otologic surgeries such as ossiculoplasty, atticotomy, eustachian tuboplasty, and ventilation tube insertion were excluded. Revision cases were also excluded. Overall, 388 ears of 367 patients, including 21 who underwent surgery of both ears, were enrolled in this study. Temporal bone computed tomography, endoscopic local finding for TM perforation size, and pure tone audiometry (PTA) were performed in all patients before the surgery. Patients who underwent TP type I but showed abnormal soft tissue density in the whole mastoid air cells were excluded from the study. The status of the ME mucosa, ossicles, eustachian tube, and presence of otorrhea were evaluated during the surgery. The patients were divided into two groups: patients who underwent endoscopic tympanoplasty (ET) and those who underwent MT with a retro-aural approach. All patients in the MT group underwent surgery before November 2016, whereas those in the ET group underwent surgery from December 2016.
All patients in this study underwent TP type I. MT was performed under local or general anesthesia. In the MT cases, an incision was made with a retro-aural approach using a no. 10 blade, 5 mm parallel from the post-auricular sulcus, reaching the temporal line at the upper border and the mastoid tip at the lower border. The deep fascia of the temporalis muscle was harvested for an autologous graft. In the external auditory canal (EAC), a posterior meatal wall incision was made using a no. 15 blade. After circumferential marginal trimming along the TM perforation with a straight and right-angled pick, the tympanomeatal flap was elevated. The ME cavity was explored and the ME ossicular chain was inspected. The ME was packed with Gelfoam (Ferrosan, Soborg, Denmark), and the obtained graft was placed below or above the handle of the malleus. Silastic sheet was applied superficially to the grafted TM. The EAC was packed with Merocel (Medtronic, Minneapolis, USA) and oint gauze. Finally, after the penrose drain was placed, it was approximated with subcutaneous and skin sutures in the retro-aural incision site. In the ET group, detailed procedures were almost identical to the MT group. Tragal cartilage was harvested with perichondrium on the outer surface using a no. 15 blade. The transcanal approach was used in all patients, with the 0°, 3.0 mm diameter, 14 cm long endoscope (Karl Storz, Tuttlingen, Germany). Transcanal meatal incision was performed using a canal knife. After performing the procedure similar to ME, the drain was not inserted, and the tragus incision site was closed with Histoacryl (B-Braun, AG, Melsungen, Germany).
We performed PTA to evaluate the patients’ hearing abilities. The average PTA thresholds were measured at 0.25, 0.5, 1.0, 2.0, 4.0, and 8.0 kHz, and the average hearing values of 0.5 – 4.0 kHz were calculated. Follow-up (f/u) PTA evaluations were performed 3 – 6 months postoperatively. In all the patients, the air-bone gaps (ABG) were evaluated preoperatively and postoperatively.
All patients underwent postoperative microscopy and endoscopy examinations whenever they visited the hospital, and the status of the graft was evaluated. All complications, including TM reperforation, graft detachment, infected grafts, and presence of discharge were noted.
Statistical analysis was performed using R software version 3.6.2. For comparing the two groups, the continuous variable was subjected to the independent t-test or Wilcoxon rank sum test, and the categorical variable was subjected to the chi-square test or Fisher’s exact test. Statistical significance was set at p<0.05.
Results
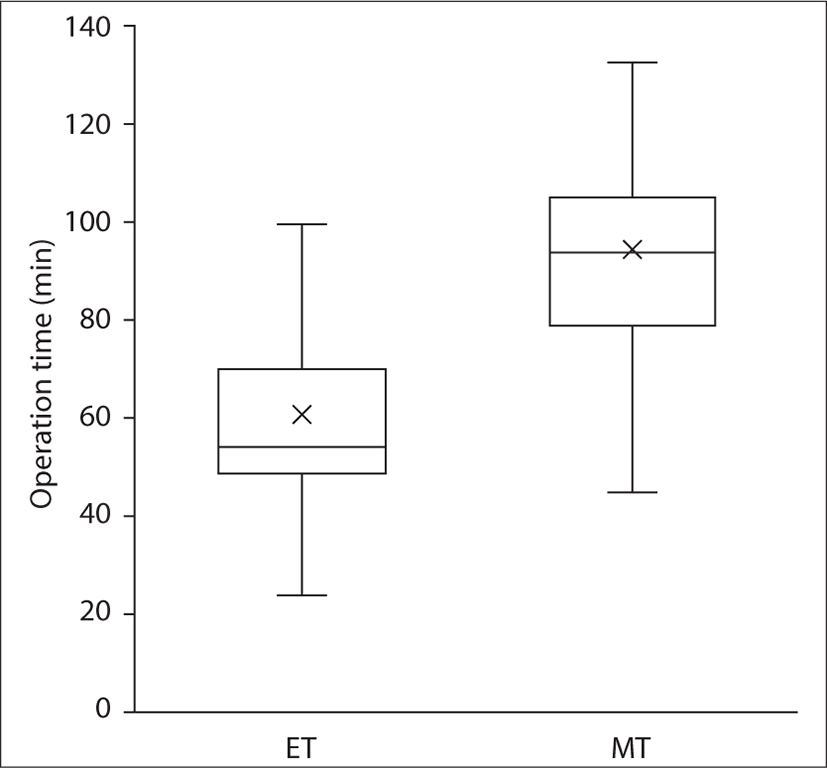
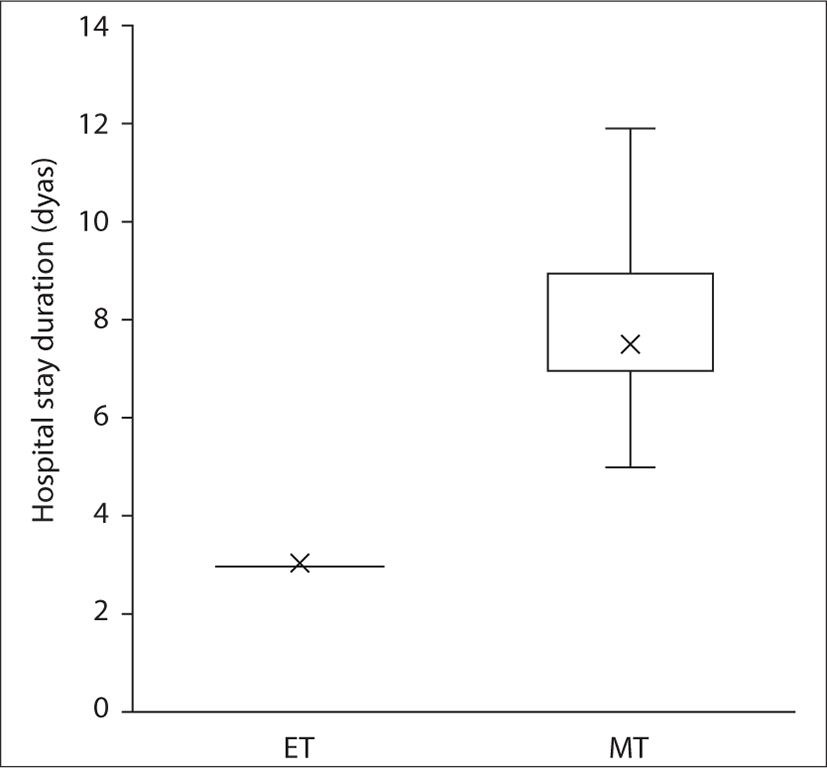
A total of 388 ears were analyzed in this study. The demographic characteristics and clinical findings of the patients in the ET (n=199) and MT groups (n=189) are shown in Table 1. The median f/u period of all patients was 8.50 months, while the median f/u period of patients after categorization into the ET and MT groups was 7.40 months and 10.52 months, respectively. The mean age was 53.84 ± 14.47 years. There were 241 (62.1%) female patients and 147 (37.9%) male patients. Of the total surgeries, 206 (53.1%) were performed on the left ears and 182 (46.9%) on the right ears. There were no significant differences between the two groups in terms of age, sex ratio, and laterality of the operated ear. The techniques of the above malleus (UAM) and below malleus (UBM) were used by the operator as the graft underlaying techniques, referred to as over-under tympanoplasty and medial tympanoplasty in other studies 16). In the ET group, UAM and UBM were applied in 39 (19.6%) and 160 (80.4%) patients, respectively, whereas in the MT group, UAM and UBM were applied in 40 (21.2%) and 149 (78.8%) patients, respectively. There was no significant difference between the two groups in the graft underlaying technique. As a graft material, Surederm was used in only one patient of the MT group, while all remaining MT cases used temporalis deep fascia (n=188), and all patients in the ET group (n=199) used tragal perichondrium as a graft. In the anesthesia method, the ET and MT groups showed significant differences (p<0.001). In the ET group, general anesthesia (154 patients, 58.0%) was more frequently administered than local anesthesia (42 patients, 21.1%), while in the MT group, the opposite was noted [71 patients (37.6%) and 118 patients (62.4%), respectively]. The median operation time for ET was 54 min (range, 49 – 70 min) whereas for MT, it was 94 min (range, 79 – 105 min) (Fig. 1). The operation time was significantly shorter in the ET group (p<0.001). Similarly, the median hospital stay duration in the ET was 3 days, which was the same for all patients in the 199 ET cases, and it was significantly shorter than the 7 days (range, 7 – 9 days) in the MT group (p<0.001) (Fig. 2).


The graft success rate for the overall cases was 94.3%. Reperforation occurred in 15 cases (7.5%) in the ET group and in 7 (3.7%) cases in the MT group. The graft success rates were not significantly different between the two groups (p=0.158) (Table 2).
| Overall (n=388) | ET (n=199) | MT (n=189) | p-value | ||
|---|---|---|---|---|---|
| Graft success | Successful | 366 (94.3%) | 184 (92.5%) | 182 (96.3%) | 0.158 |
| Perforated | 22 (5.7%) | 15 (7.5%) | 7 (3.7%) |
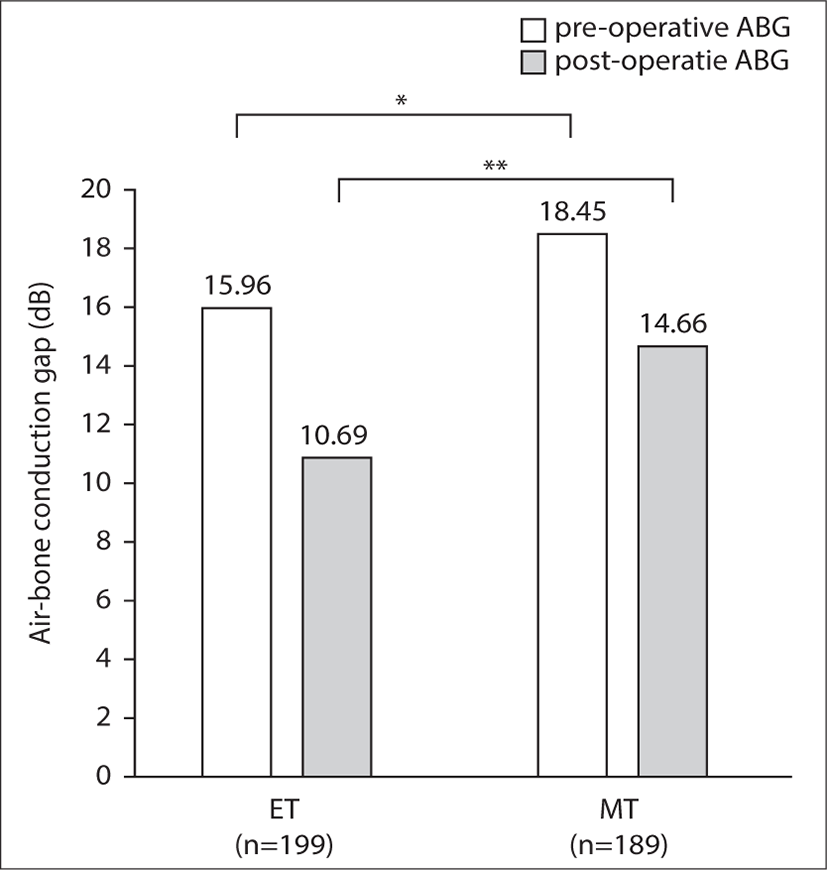
In Table 3, hearing improved at all frequencies except the 8 kHz frequency of the MT group; however, no significant difference was found between the groups. Another finding was reduction in the hearing gain from a low frequency to a high frequency in both groups. Preoperatively, the average AC was 41.55±17.21 dB HL in the ET group and 43.39±21.37 dB HL in the MT group, whereas postoperatively it was 34.85±17.82 dB HL and 42.15±28.70 dB HL, respectively. The average AC gain was 6.96±9.04 dB HL in the ET group and 7.36±10.66 dB HL in the MT group. The difference between the groups for AC gain was not statistically significant (p=0.815). Both pre- and postoperative ABG were smaller in the ET group. The preoperative ABG in the ET group and MT group was 15.96±7.42 dB HL and 18.45±8.18 dB HL, respectively, with a statistically significant difference (p=0.002). Likewise, the postoperative ABG was significantly different between both groups (10.69±7.51 dB HL in the ET group vs 14.66±10.54 dB HL in the MT group; p=0.019). In addition, ABG improved by 5 – 6 dB HL in both the groups (Fig. 3). The improvement in ABG was 5.79±8.93 dB HL in the ET group and 6.90±8.11 dB HL in the MT group. However, the difference between groups in ABG improvement was not statistically significant (p=0.423).
As shown in Table 2, there was no difference in graft success rate according to the surgical method. Table 4 shows the relationship between other clinical factors and the graft success rate. As a technique for underlaying the graft material, there was no difference in the success rate according to the two different methods, UAM and UBM (p=0.076). Similarly, there were no significant differences in graft reperforations per the graft materials (p=0.176). There were no cases of graft failure in seven cases with small size of perforation before surgery, and reperforation cases in the remaining medium, large, and total perforation groups, although the difference was not significant (p=0.078). The presence of otorrhea, mobility of the ossicle chain, status of mucosa, patency of the eustachian tube, and existence of cholesteatoma were not significantly related to the surgical success rate.
Discussion
Techniques and biomaterials used for reconstructive ME surgery are under steady, ongoing development. Comparison of surgical success or hearing outcomes of tympanoplasty techniques has been discussed for many years. Several studies concluded that the endoscope allowed for a wider field of view, potentially shorter operative time, and improved visualization of difficult locations such as the anterior marginal perforations.17,18) In addition, a previous meta-analysis demonstrated that patients undergoing ET had significantly lower canaloplasty rates, better cosmetic outcomes, and shorter operative times than those undergoing MT.19) Nevertheless, there are limitations to endoscopic surgery. Disadvantages of the endoscope include the one-handed surgical technique, loss of depth perception, limited magnification, and the need for training.20)
There was a significant difference in the duration of f/u between the two groups (p<0.001). Based on the most recent outpatient date, the f/u period of the MT group, which was performed in the past, had a longer f/u period.
For more invasive surgery, general anesthesia is commonly required; therefore, MT often requires general anesthesia and ET is performed under local anesthesia.21) There was a significant difference between the ET and MT groups in the anesthesia methods, where more patients undergoing ET were under general anesthesia. However, considering the tendency of the anesthesia methods of other surgeries performed in the PNUH in the past to use more local anesthesia and more recently general anesthesia, there is a limit to the interpretation of the difference in anesthesia methods according to the surgical method. In addition, this result did not correspond to those of the prior studies.
The overall success rate of TP type I in individuals with two surgical methods was 94.3%. This result exhibited a success rate comparable with those reported in previous studies.3-5) Hsu et al.14) concluded that the outcomes of transcanal endoscopic ear surgery vs. microscopic ear surgery were similar, with graft success rates of 96.2% and 92.0%, respectively (p=0.2826). Choi et al.12) also reported that no significant differences in the condition of the graft were observed in patients who underwent endoscopic (graft success rate: 95.8%) or microscopic tympanoplasties (graft success rate: 100%, p=0.304). The graft success rate of ET was 92.5%, and MT was 96.3% in our study (p=0.158). These outcomes are also consistent with those obtained in previous studies.
Surgery as a treatment for COM aims to not only heal the TM but also achieve improved hearing. For patients in the ET and MT groups, the ABG improvement was 5.79±8.93 dB HL and 6.90±8.11 dB HL, respectively. Dundar et al.13) documented that the preoperative ABG after type I ET and MT was approximately 20.40±4.33, and 21.34±3.90 dB HL and the postoperative ABG was 8.12±3.27, 8.13±2.43 dB HL, respectively (no significant differences between the two groups, p>0.05). In our study, the pre- and postoperative ABG in the ET group was 15.96±7.42 and 10.69±7.51 dB HL, and in the MT group, it was 18.45±8.18 and 14.66±10.54 dB HL, respectively, which were lower than those reported in previous studies for both groups. Nevertheless, ABG improved in all groups, although other studies did not demonstrate a difference between the two groups (p=0.423).
Operation time is an important factor in terms of the duration of anesthesia and postoperative restoration of patients. In a previous study, Ghaffar et al.22) indicated that the mean operation duration in 132 cases was significantly shorter in the otoendoscopy group than in the scutum lowering group (62.85±15.57 min vs. 71.23±15.65 min, p<0.005). Similarly, the mean operation time among the 199 patients who underwent ET was 54.00 min, which was significantly shorter than that in the 189 patients who underwent MT (94 min, p<0.001). This difference is because the incision was not long, additional suturing was not required, and it took less time to secure the field of view in ET.
Nassif et al.23) reported the results of children’s tympanoplasty type I. Patients in the microscopic approach group were discharged 1, 2, and 3 days after surgery in 3 (13%), 18 (78.3%), and 2 cases (8.7%), respectively; conversely, in the endoscopic approach group, patients were discharged in 1 and 2 days after surgery in 17 (77.3%) and 5 cases (22.7%), respectively (p<0.001). Conversely, there is little information about the length of hospital stay in adults. This study compared the duration of hospital stay in both the groups, ET and MT. In the study involving children, the length of hospital stay in the ET group was significantly shorter (p<0.001). However, there was a difference in the number of days. In this study, the duration of hospital stay in the ET group was 3 days (2 days after operation), which was identical for 199 patients, and the duration of hospital stay in the MT group was 7 days (6 days after operation).
Choi et al.12) demonstrated that, when pain is evaluated 1 day after surgery using the visual analog scale, the endoscopic group had significantly lower level of pain than the microscopic group. In a meta-analysis study comprising 80 patients that evaluated cosmetic results as poor, satisfactory, and excellent, those receiving endoscopic ear surgery had an odds ratio of cosmetic satisfaction rate of 26.94 times compared to those receiving microscopic ear surgery.24) Thus, cosmetic satisfaction is also considered to be different between the two groups. Our analysis is a retrospective study, which lacks objective indicators for such factors, and thus, cannot be analyzed.
To the best of our knowledge, this study analyzed most cases (n=388) of studies that compared ET and MT. In previous studies, most cases were conducted in a single institution; however, reports on single operators were rare. This study was designed to analyze the results of surgeries performed by a single surgeon. Prior to November 2016, all patients underwent MT, and after December 2016, patients underwent ET. In other words, there are many cases where ET has been performed with a relatively large amount of surgical experience; thus, a bias may exist.
We analyzed the surgical results for the operation method as well as the TM perforation size, ME status, such as presence of otorrhea, mobility of the ossicle chain, status of mucosa, patency of the eustachian tube, and existence of cholesteatoma. None of these parameters had significant results in graft success rate. Another limitation of this study can be that the perforation location and perforation size, which are important factors involved in the success rate of tympanoplasty, were not included in the present study.
Conclusions
As endoscopic ear surgery is gradually replacing the microscopic approach, several studies comparing the two surgical methods have been conducted. Our findings suggest that ET can improve hearing outcomes and achieve better graft success compared to conventional MT with a retro-aural approach. Moreover, ET requires shorter operation time and shorter hospital stay than MT. In summary, ET could be used as a substitute for MT for repairing perforation of the TM.


